
The University of Texas System
- Rachel Raymond
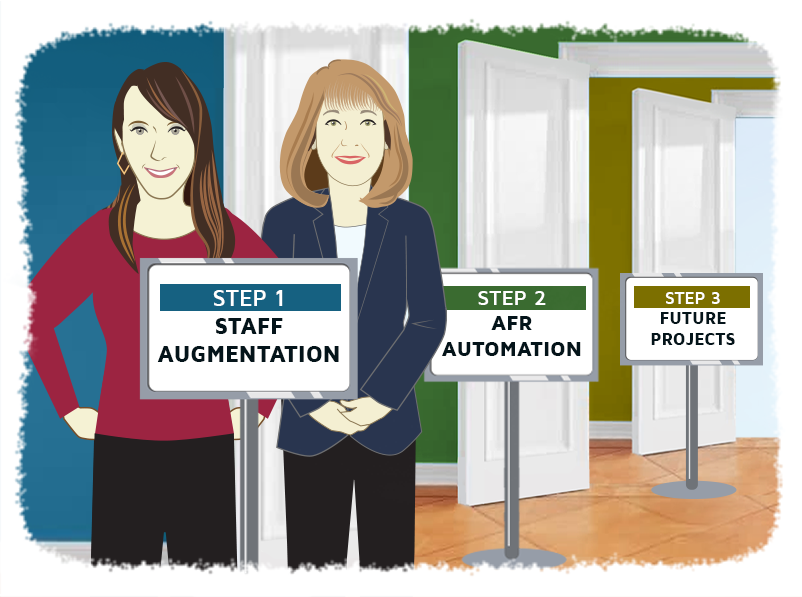
- Financial Reporting
- minute(s)What Starts Here Changes the World: An Incremental Approach to System Improvement Projects: Staff Augmentation, AFR Automation Organization: The University of Texas System, Founded in 1883 Number of Students: 256,000 Platform: Workiva At FHB, our client engagements are anything but transactional. We get to know our clients’ teams, their systems, and their challenges, forging long-term relationships that often span multiple projects and many years. Such is the case with The University of Texas System. The Beginning When we first spoke with UT System, they had been considering implementing Workiva for process improvement and automation for several years but were unable to get internal buy-in for the necessity of a new approach. Fortunately, Veronica Hinojosa Segura, NACD, D.C., the System’s Associate Vice Chancellor, began to get her team’s buy-in once FHB demonstrated the “art of the possible.” “When I came on to this role six years ago, I was surprised to find that we were a $45 billion net-position organization, still consolidating financial statements with Word and Excel,” said Veronica. “It took almost an army of people. Once we received information from the campuses, to even try to consolidate, there was a lot of copying and pasting. So, inefficiency was the biggest driver for [change]. And then selfishly, my goal was to become best in class out of all the university systems in the country,” she said. During that time, UT System lost several key finance team members, which led them to believe they would need to kill the process-improvement project altogether. They would have enough problems just completing year-end the old way, let alone taking on something new. “Around 120 years of institutional knowledge went out the door,” said Veronica. FHB agreed that this development would put the implementation at risk. Instead of letting the team get stuck in a catch-22 situation (needing new tools to become more efficient and require less staff time, while being unable to implement new tools because of needing more staff time), we pointed out that many clients hire FHB for staff augmentation, as we have a deep bench of CPAs with decades of experience working in the public sector, doing exactly the kind of work required of the UT team. That experience has given them first-hand knowledge of historic and upcoming pronouncements, including GASB 87, 94, and 96. We proposed that the UT System team start “phase one” of their improvement initiative by hiring FHB to support them through year-end and ensure their success. This engagement provided the added benefit of allowing us to learn their processes and challenges firsthand. Project One: Staff Augmentation In 2022, the UT System team was “stretched pretty thin,” said Jamie Frey, Director of Financial Innovation. At the outset of our engagement, they tasked the FHB team with consolidating variances in their Annual Financial Report (AFR); writing an explanation for the variances in the report’s management, discussion, and analysis (MD&A) section; and reviewing its footnotes. “The FHB team did a great job,” said Jamie. “They have the expertise…I particularly liked the organized way they communicated back to us. Jan (FHB Principal Consultant Jan Brewer, CPA, CGMA, MBA) was instrumental in that. There was a worksheet, with a summary tab, and then it went into detail. And it was very easy to review. It had stoplights indicating issues or things we needed to look at. It was very organized, so it allowed us to easily look at the overview and see what we needed to dig into,” she said. The success of the four-month Staff Augmentation project set the stage for future engagements between FHB and UT System. Project Two: AFR Automation Next, FHB undertook the project to help UT System streamline and improve their AFR preparation process, using reporting automation platform Workiva. The Team Throughout the AFR project, FHB’s expertise and experience shone through. The UT team was thrilled with the combination of accounting acumen and technical expertise demonstrated by our team. They were further impressed with our deep understanding of Workiva. Jamie also commended the project management leadership of FHB’s Kelsey Macke, PMP. “The team was very knowledgeable. The running of the meetings was very organized, the project plan was very organized and laid out. The FHB team pivoted when needed. In terms of running projects, they're very skilled,” she said. “You have an excellent team,” Jamie added. I want to thank everyone we worked with; it was a pleasure. So much talent, and the kind of talent that we needed on this project,” she said. “I was pleasantly surprised at the ease of automating the process,” said Veronica. "Obviously, this was not FHB’s first rodeo; you had a template we could follow that made it so much easier for us. And Workiva is a very user-friendly tool. It looks and feels like Excel, something that my team was already used to,” she said. The Outcome In terms of the project’s outcome, UT anticipates significant time savings (particularly in the MD&A section of their AFR); improved collaboration; and mitigation of error. “For us, I think collaboration is probably number one,” said Jamie. “I love the commenting feature. I love how you can filter and see what's for you. I love that our auditors can go directly in there and make their comments and it's going to be the latest version. We can respond directly and they can see the edits directly,” she said. “We probably cut about three and a half to four weeks of time [out of the AFR process], which came just in time, since the Comptroller's office has shortened our deadline,” said Veronica. The UT System team is also happy to have established a repeatable, formalized business process that will help potential new hires and users get up to speed more quickly. And last, but not least, the UT Team was thrilled with the Capstone Training provided by FHB at the project’s completion. The Capstone package includes one video that walks through UT System’s specific AFR process steps, and another video providing answers to their remaining questions. “The Capstone video was excellent. I think you'll continue to hear that from your clients. That’s a great resource and we appreciate y'all doing that so much,” said Jamie. At the close of the AFR project, the UT team felt well-positioned for the future. “We’re already seeing, as we roll this forward, some things that we can implement in the future to continue to make improvements. We’re so excited to see where this goes,” said Jamie. “I absolutely think we're on the right track. This was a change that we needed,” said Jamie. © 2025 FH Black Inc. All rights reserved. Content may not be reproduced, excerpted, distributed, or transmitted without prior written consent.
With the assistance of FHB's experts, The University of Texas System met their pressing deadlines and cut three to four weeks from their AFR preparation process.
READ MORE

The ADA & US Government: What you need to know in 6 minutes
- Jamie Black
- Financial Reporting
- minute(s)While many have heard of the Americans with Disability Act (ADA), few truly understand its importance: Why should a finance or budget professional care about it? What do the laws (there are three) specifically require? How must I comply with the laws? This article answers these questions. 1) Finance & Budget Departments Should Care Designing documents that are easily understood by your audience is challenging. When some of your audience have visual impairments, there is an additional set of considerations. There are three primary reasons you should care about this topic: As a public sector organization, you want your message available to everyone. Approximately 5.5 million people have visual impairment in North America today. This is expected to double by 2050. To “read” your Comprehensive Annual Financial Report or Budget Book, visually impaired individuals must use assistive technology. These tools read the PDF to them electronically. Unless specifically designed for accessibility however, your PDFs will not be readable by assistive technology. Your organization is legally required to ensure all public documents are accessible (readable by assistive technology). Accessibility for your documents is legally mandated if: you work in a local government, a federal agency, or, a place of "public accommodation" (privately-owned, leased or operated facilities like hotels, restaurants, retail merchants, doctor’s offices, golf courses, private schools, daycare centers, health clubs, sports stadiums, movie theaters, and so on), and you are located in the United States, and you publish content to a publicly accessible website. Numerous lawsuits have been launched for failure to ensure accessibility both for businesses and local governments. As identified by Seyfarth Shaw LLP, these lawsuits are becoming more and more prevalent. 2) The Laws Mandate Accessibility Section 508 of the Rehabilitation Act of 1973 In 1998, Congress amended the Rehabilitation Act of 1973 to require Federal agencies to make their Electronic and Information Technology (EIT) accessible to people with disabilities. The law (29 U.S.C § 794 (d)) applies to all Federal agencies when they develop, procure, maintain, or use electronic and information technology. Under Section 508, agencies must give disabled employees and members of the public access to information comparable to the access available to others. On January 18, 2017, the U.S. Access Board published a final rule updating accessibility requirements for Information and Communication Technology (ICT) covered by Section 508 of the Rehabilitation Act and Section 255 of the Communications Act. E205.4 of this final rule stipulates the accessibility standard mandated by Section 508: Electronic content shall conform to Level A and Level AA Success Criteria and Conformance Requirements in Web Content Accessibility Guidelines ( WCAG 2.0) (incorporated by reference, see 702.10.1). Americans with Disabilities Act (ADA) It was signed into law on July 26, 1990, by President George H.W. Bush. The ADA is one of America's most comprehensive pieces of civil rights legislation that prohibits discrimination and guarantees that people with disabilities have the same opportunities as everyone else. The ADA has three "Titles" (think sections), and it is Title II that applies to the programs and activities of state and local government (title I is employment practices and title III covers private entities that are considered public accommodations). While the ADA does not explicitly reference requirements for web content, the Department of Justice (DOJ) Civil Rights division has confirmed their opinion that the ADA does in fact cover content on web sites. Unfortunately, there is no technical definition for ensuring your web content complies with the ADA. Congress sought clarification from the DOJ in 2018, but their response was noncommittal as to the standard required: Absent the adoption of specific technical requirements for websites through rulemaking, public accommodations have flexibility in how to comply with the ADA's general requirements of nondiscrimination and effective communication. In late July 2019, a series of questions were again raised to the DOJ from several senators looking for clarification. In particular, the senators attempted to learn if the DOJ "consider WCAG 2.0 an acceptable compliance standard". No response from the DOJ has been received as of this writing. California Assembly Bill No. 434 This legislation states that by July 1, 2019 all web content of the state agency or entity must meet... the Web Content Accessibility Guidelines 2.0, or a subsequent version, published by the Web Accessibility Initiative of the World Wide Web Consortium at a minimum Level AA success criteria. 3) Standards Determine Compliance Web Content Accessibility Guidelines (WCAG) Two of the three pieces of legislation above specifically reference Web Content Accessibility Guidelines 2.0 as the relevant standard that our documents must conform to. These guidelines were developed by the World Wide Web Consortium (W3C), an international community that develops open standards for the Web. WCAG 2.0 contains 12 guidelines designed to make content published on the web more accessible for those with impairment. Testable criteria are also provided to allow for the assessment of your content. Any piece of content can be assessed into one of three levels of conformance : A (lowest), AA, and AAA (highest). Note that the legislation mentioned above specify the level that your content must achieve. PDF/Universal Accessibility (PDF U/A) We mention this standard here as you may hear it and be confused by it. PDF/UA is the informal name for ISO 14289, the International Standard for accessible PDF technology. A technical specification intended for developers implementing PDF writing and processing software, PDF/UA provides definitive terms and requirements for accessibility in PDF documents and applications. PDF/UA defines the technical specifications to enable PDF documents to meet WCAG 2.0, but WCAG 2.0 has additional requirements that call for an author’s attention. For these and other additional requirements, the W3C’s technique documents (both general and PDF-specific techniques) guide authors interested in complying with WCAG 2.0. In short, if you are a state or local government in the United States and want to be confident that you comply with the various pieces of legislation, all content you publish to the web must conform to WCAG 2.0 level AA standard. Watch this space for our next article on the technical requirements of WCAG 2.0 and a methodology to employ to make your published documents fully compliant with the standards mandated by the ADA, Section 508, and California Bill 434. © 2025 FH Black Inc. All rights reserved. Content may not be reproduced, excerpted, distributed, or transmitted without prior written consent.
Accessibility - Why should finance & budget professionals care? What do the laws (3!) require? How can you comply? This article provides the answers.
READ MORE

What do you mean? How to be sure your readers understand you
- Jamie Black
- Financial Reporting
- minute(s)Communicating is difficult at the best of times. When our topic is complex and, let's be honest, boring, the job is even harder. In this article, we will tackle one very useful technique for ensuring the readers of your financial reports and budget books understand what you are attempting to convey. The single biggest problem in communication is the illusion that it has taken place. George Bernard Shaw As we have discussed in previous posts, text is one of the three essential tools at your disposal when trying to communicate non-verbally. Recall, the purpose of text is to: introduce a topic, a problem, a business process, or other item that the reader might not be fully conversant in, explain a graph or the table so the reader does not miss any nuances, highlight or call out a particular point in a table or graph, label a specific data point in a graph or columns or rows in a table, recommend appropriate next steps or actions. When using text, however, not all words or the sentences they create are equal. Readability Readability is the degree that the prose you write can be understood. Readability is influenced by: word length, use of conventional or unique words, sentence length, number of clauses in each sentence, number of syllables in each sentence, A common but bad habit for writers is to prefer longer, wordier, and more complex text. In almost all cases, this is a mistake. When trying to communicate complex information, as is often the case for finance and budget officers, focus on simplicity. Simplicity makes understanding easier and faster for your reader. After all, who has not abandoned reading an article because it was too long or too hard to follow? Some tips to consider to improve the readability of your text: avoid jargon and acronyms, omit unnecessary words, use shorter sentences, consider the reading level of your audience. Testing Readability If you want to improve readability, test your text. There are numerous readability-formulas & tools you can use. One popular formula is the Flesch-Kincaid Grade Level. It attempts to measure the approximate grade level required to understand the text. There are numerous tools that will use this and other formulas on your text. From tools that only test the Flesch-Kincaid Grade Level (ReadabilityFormulas.com) to broader tools that also asses grammar more generally (Grammarly & Readable) there are many options to choose from. The results of testing your text can be surprising. An Example Imagine you are drafting an introduction to your budget book. Your goal is to explain to the reader some of the high-level goals of the organization. You want them to understand the principals that lead to designing the budget council adopted. Here is the first paragraph you initially write: The City's annual budget is created to reflect the Mayor's priorities and address community needs each year. The budget process takes place over a five-month period, during which agencies propose new or expanded programs and investments to better serve the public and meet the goals set out by the City. The Budget & Management Office staff assess proposals for their merits across a collection of considerations, with the first among them being the Mayor's Strategic Framework. This framework, shown in the graphic below, illustrates Mayor Smyth's dynamic priorities as it relates to creating a world class city where everyone has access to a home, a job, and a content future. The following pages outline key strategies and investments for priority areas and the metrics used to calibrate success. The score of this text: 128 words Average word length is 5.2 characters 5 sentences Average sentence length is 25.6 words Reading time: 30 seconds Flesch-Kincaid Grade Level: 14 (college level) This scoring may not immediately cause you concern. If you consider the average level of education in your community, however, you will see the problem. First, only 61.8% of Canadians and 49.8% of Americans aged 25 to 34 had either college or university qualifications. Secondly, most people prefer to read a few levels below their absolute maximum comprehension level. A second draft of the paragraph revised to improve readability: The City's annual budget reflects the Mayor's priorities and addresses community needs. First, agencies propose new/expanded programs. Budget & Management Office staff then assess these proposals for their merits. This process takes five months. The graphic below illustrates Mayor Smyth's priorities to create a world-class city where everyone has access to a home, a job, and a future. The following pages outline strategies for priority areas. They also provide the measures used to determine success. The score of the revised text: 75 words (decreased 53 words) Average word length of 5.6 characters (increased slightly) 7 sentences (increased by 2) Average sentence length is 10.7 words (decreased by approximately 15) Reading time: 18 seconds (decreased by 12 seconds) Flesch-Kincaid Grade Level: 9 This second version of the text reduced reading time by 40% and made the content understandable to more of our potential audience. Evaluate the readability of your text and make it as easily comprehensible as possible. Improving readability is one essential and easy step to improving your communication. © 2025 FH Black Inc. All rights reserved. Content may not be reproduced, excerpted, distributed, or transmitted without prior written consent.
Communicating complex information is a challenge faced everyday by finance & budget departments. This article explores one key to success - readability.
READ MORE

Best Practices for Financial Reporting - Eliminate rounding errors
- Jamie Black
- Excel
- minute(s)Complex reports (Financial statements / Comprehensive Annual Financial Report, Budget Book, etc) often present the same value in multiple locations in multiple ways. For example: on page 5 we show total revenue, on page 100 revenue is broken down by type, and on page 200 revenue is broken down by source. The trouble is, the value on page 5 and the total of the break-downs on pages 100 & 200 must all agree. The most common reporting tools (Word & Excel) do not have good methods to confirm and enforce that agreement (see how CaseWare Working Papers solves this problem here). You're left with a manual, error-prone process. The amount of detail provided in even a moderately complex report means rounding errors likely occur hundreds of times. This requires massive time investment during the reporting process to check & double check & triple check as your proceed through the reporting process. This article will explore just one of the common causes of disagreement between these values and suggest best practices to minimize failures of agreement. Different Rounding Approaches Lead to Disagreement As we have examined in our post Best Practices for Financial Reporting with Excel (Step 2), the optimal method for dealing with these 3 different revenue presentations is by linking back to central data source. We will assume you are following this advice. Let's use the following as our central data source (G/L): Approach 1 On page 5, where we just need total revenue we would enter a formula that adds all of the individual account values and rounds the result. Your page total 5 will show total revenue as $804. Approach 2 But what about on page 100 where we present revenue by type? The problem becomes apparent. When we need to present more detail, we round each individual account value and then add up those rounded values. Your page 100 will show total revenue as $801, which does not agree to the total of $804 presented on page 5. In other words the problem is we use different approaches to rounding: Approach 1 adds raw values and rounds the total Approach 2 rounds raw values and then adds them The Solution This problem may seem trivial: "Just link the values together!" For example, the value on page 5 might be a cell reference formula to the total of the revenue by type on page 100. As we discussed in our post Best Practices for Financial Reporting with Excel (Step 2) this causes other problems and only "solves" this problem in one location. It does not address the total on page 200 or any of the other locations that we provide break downs. A better way to address this problem is to attack the foundation of it; always use a single approach to rounding! We must choose one of the two approaches. Given that we must provide detailed disclosures which must be presented rounded to the nearest dollar in many locations we are forced to select the rounding model used in the detailed break-down schedules everywhere. So the recommendation is: If you must present detailed but also rounded disclosures, round all account values in your report and then add them. Thus the value on page 5 becomes $801 which will agree "per-force" with all other presentations. By following this model you will immediately eliminate all of your "true" rounding issues. In coming articles we will discuss some of the other causes of disagreements. © 2025 FH Black Inc. All rights reserved. Content may not be reproduced, excerpted, distributed, or transmitted without prior written consent.
Many finance departments use spreadsheets where rounding errors are a continual struggle. This article presents best practices to minimize rounding errors.
READ MORE

Best Practices for Financial Reporting with Excel (Step 2)
- Jamie Black
- Excel
- minute(s)In the last part of this article series, we recommended taking some time to confirm that spreadsheets are the right tool for a specific financial reporting task. If you do conclude that a spreadsheet is the best tool for the job, you have to be careful to set youself up for success. The wide-open nature of Microsoft Excel means there are ample opportunities to "shoot youself in the foot." By following these best practices, you can avoid some of the pitfalls that come with using such a general-purpose tool for your specialized reporting tasks. Let's get started! Step 2: Minimize Data Sources Take a minute and list all the reports your finance department must create in a year. At a minimum your list likely includes: annual financial statements, quarterly statements, management discussion & analysis (MD&A), financial plan or budget documents, actual to budget reports that you present on a monthly or quarterly basis, forecasts where you analyze actuals and project how well you will meet budget, Tens or hundreds of specific purpose reports. Things like bank covenant reporting or provincial reporting (FIR, LGDE, SOPHI) The point is, there are a lot of reports and each one needs to present data slightly differently. More detail in one, less in another. One includes actuals only, this other adds budget data. This one shows capital expenditures as expenses, but another one treats them as assets. Consequently, folks tackle each one of these reports as a discrete task. Consider the example of a finance department who is working to prepare the Q1 financial statements and the accompanying MD&A. The data from the accounting software (often referred to as the ERP system) is exported to begin building the financial statements. In this case, the Excel file becomes the direct data source for the financial statements. When the statements are nearly complete, either the spreadsheet file that houses the financial statements is copied or another export from the accounting software is created so that the team can work on the MD&A. Now imagine the auditor comes back and requires an adjustment be posted. This change needs to effect both files. Not only must finance make the change twice, but there is also now the need to reconcile the data between the two Excel files to ensure that the Financial Statements and MD&A agree. Compare this to an approach where the MD&A is built off the same Excel file. Changes made in one file necessarily effect both the statements and the MD&A. Reconcilliation of the two reports becomes much faster and simplier. While this may seem obvious, we rarely see this practice implemented consistently. In part this is caused by difficulties in sharing an Excel file across multiple users or difficulty in dealing with variations in grouping of data. Whatever the reason, when you consider all the reports that the team tackles, duplication of data sources leads to massive amounts of wasted time regrouping data, adjusting in multiple locations and then reconciling to ensure the values balance across data sources. The very same only different This same best practice of minimizing data sources also applies within a single spreadsheet. Take Cash as our example. Typically, cash needs to be presented in two or three places: a summary line on the balance sheet a summary line at the bottom of the Statement of Cash Flow a detailed breakdown in a Cash and Cash Equivalents note Option 1: Indiscriminate Linking In this option, the focus is on creating the report as quickly as possible. Consequently, there is little discipline applied to how these values are populated. The result is multiple approaches to getting the same value : The note details are populated by summation of GL accounts. The Statement of Cash Flow value is created by summing the lines above. Finally, the Balance Sheet value is based on linking to the total of the note. This is done to ensure the note and Balance Sheet values agree. Option 2: Minimize Data Sources This option focuses on long term benefits instead of speed of initial creation. The focus is on standardization and consistency. Wherever possible values are derived the same way: The note details are populated by summation of GL accounts. The Balance Sheet value is also populated by summation of GL accounts. The Statement of Cash Flow value is created by summing the lines above. This variation in approach is necessary to ensure the integrity of the statement. At first glance these Option 1 and Option 2 may appear equally good. But, having values derived in lots of differing ways can cause numerous complications: Secession planning - If there are a large variety of methods used to populate statements, it can be much more challenging for new staff to use the existing template properly. Less variety = Easier to Learn. Quality control - Consider that if all cells on the balance sheet are consistent, it is easier to review formulas to ensure accuracy and completeness. If there is great variability in the linking methods (and therefore the formulas) review gets much more complicated. Cross-Linking means 0% or 100% - Notes often contain much higher levels of detail than statements or schedules. As a result, notes regularly take more work and therefore time to complete. If the values on the Balance Sheet are linked from notes, your Balance Sheet will remain out-of-balance and unusable until every last line item detail in the notes is in place. Look for our next article "Best Practices for Financial Reporting with Excel - Step 3" where we'll discuss more ways to mitigate the risks inherent in financial reporting using spreadsheets. © 2025 FH Black Inc. All rights reserved. Content may not be reproduced, excerpted, distributed, or transmitted without prior written consent.
Best Practices for Financial Reporting with Excel Step 2: Minimize Data Sources
READ MORE

Best Practices for Financial Reporting with Excel (Step 1)
- Jamie Black
- Excel
- minute(s)In the first part of this article series, we discussed why spreadsheets can be problematic. In short, spreadsheets are cheap, available and flexible, but they are very high risk! As finance professionals, how do we improve our processes to mitigate the risk but get all the benefits? Step 1: Confirm spreadsheets are the right tool As with anything else, the key is to find the right tool for the job. The simplest way forward is to calculate (accountants love this part) a score. The higher the score, the more you should be looking to find an alternate approach to spreadsheets: Frequency - How many times a year will this tool be used? Users - How many different people will use the tool? Standardization (1-10) - How much change in format is required for each use (see frequency above) Complexity (1-10) - Are we talking about a 10 row spreadsheet or a series of workbooks linked together with hundreds of tabs? Required Accuracy (Percentage) - What percentage of accuracy must be maintained? Multiplying each of these values results in your Value of Replacement (VR) score. Consider an example with one of our clients: They were being asked to forecast performance 3 times a year. They would take data from the General Ledger, export it out into 20 Excel workbooks. Each spreadsheet contained hundreds or thousands of rows. They then distributed those spreadsheets to 20 users . Users had to go row-by-row, assess actuals and develop a model for how to forecast the balance to the end of the year Finally each user returned their spreadsheet to Finance. Finance then combined the spreadsheets back into one workbook and did analysis. Ultimately Finance needed to summarize the data and prepare a final report (tables of data and narrative explanations) to council. Their VR score: 3f x 20u x 8s x 9c x 99%r = 4,277 Now what if this work was very simple? 3f x 20u x 8s x 1c x 99%r = 475 As you can see, the first scenario yields a much higher value for replacement than the second. And by comparing the VR scores of different processes, you can determine which ones to prioritize to yield the most benefit from new tools and automation efforts. For the others, Excel may be the perfect tool for the job. But that doesn't mean you're done - not all spreadsheets are created equal. Look for our next article "Best Practices for Financial Reporting with Excel - Step 2" where we'll begin discussing ways to mitigate the risks inherent in Excel reporting. © 2025 FH Black Inc. All rights reserved. Content may not be reproduced, excerpted, distributed, or transmitted without prior written consent.
Spreadsheet applications like Excel are incredibly flexible and easy to use tools but if you are not careful, they can kill your career. Step 1 of this process is covered in this article.
READ MORE

Financial Reporting with Spreadsheets - Avoiding the Traps
- Jamie Black
- Excel
- minute(s)Finance professionals around the world use spreadsheets for nearly every purpose imaginable. We have seen finance officers use spreadsheets to prepare their year end financial statements, file their FIR, prepare quarterly variance reports and produce their SEC filings. We know auditors who use Excel to do data analysis, gap detection on cheque numbers, and identification of duplicate payments. Why spreadsheets? While there are certainly a great variety of causes for the ubiquitous use of spreadsheets, we would suggest 3 major reasons: Availability - your organization almost certainly owns a spreadsheet program (likely Excel). If not, Google Sheets, OpenOffice and Libre Office all provide free tools. Nothing gets accountants excited like a no-cost solution. Flexibility & Power- They can be made to do just about anything. We have seen clients with 50 to 100 spreadsheets all daisy-chained together acting as their database. Why? Because they could. Ease of Use - With very little training on the software, nearly anyone can open Excel and quickly create a very sophisticated tool to solve a burning issue. So what's the problem? There are two major issues with Excel and they build off of each other: Spreadsheets are very susceptible to error: "In general, errors seem to occur in a few percent of all cells, meaning that for large spreadsheets, the issue is how many errors there are, not whether an error exists." What we Know about Spreadsheet Errors - Raymond Panko No doubt you have encountered some or all of these mistakes: someone over-typed a calculation or created a formula incorrectly (include too many rows in a Sum for example) or hard-coded a value in a cell that changes often or forgot to update a value after it had changed or rows / columns are cut off in print-ready version Few people perceive how common these errors are: "As noted earlier, when Brown and Gould (Brown & Gould, 1987) gave three spreadsheet development tasks to nine highly experienced spreadsheet developers, all made at least one error, and 63% of the spreadsheets overall had errors. Yet when asked about their confidence in the correctness of their spreadsheets, their median score was "very confident." What we Know about Spreadsheet Errors - Raymond Panko The result all too often is major catastrophe and disaster. If you think I'm exaggerating, consider this article from Fortune.com: Damn Excel! How the 'most important software application of all time' is ruining the world...The popular Microsoft program has been implicated in the financial crisis, Europe’s growth problems, the U.S.’s weak economic recovery, and pretty much everything else....read more So no more spreadsheets? Abolishing all spreadsheets from your organization, while momentarily appealing is just not practical. Just this week in-fact we had a client tell us that unless their requested solution resulted in Excel files, their users would revolt! So if we can't live with 'em and can't live without 'em, what are you to do? In this series of articles we will explore a 4 step approach to Optimizing Excel (and other spreadsheets) as your financial reporting tool: Step 1: Confirm a spreadsheet is the right tool Step 2: Standardize your spreadsheets Step 3: Use variabilization, error-checking & data tagging Step 4: Lock & document your spreadsheets © 2025 FH Black Inc. All rights reserved. Content may not be reproduced, excerpted, distributed, or transmitted without prior written consent.
Excel is incredibly flexible & easy to use tool for financial reporting but if you are not careful, it can turn into a trap
READ MORE
